
Market Analysis · July 2026
Prepared exclusively for
Marc Cooper
6801 SW 75th Terrace
South Miami, FL 33143
Scroll to explore

I'm a full-time real estate professional based in Coral Gables, proudly serving the greater Miami area for over 8 years. I specialize in character homes, investment properties, and relocation — with deep roots in South Miami, Coral Gables, The Roads, and the surrounding neighborhoods. Having relocated from New Jersey and built a career here from the ground up, I understand exactly what draws buyers and developers to South Miami and what makes land opportunities like this one genuinely irreplaceable. I combine market knowledge with a modern, data-driven approach and a marketing engine built to put your property in front of the right buyers.
Prepared for Marc Cooper
Four comparables anchor 6801 SW 75th Terrace squarely in the $2.05M–$2.25M range. Two nearly identical land-value plays closed within $5,000 of each other at $2,055,000 and $2,060,000. A third went under contract in just 10 days at $2,100,000 — the strongest demand signal in the set. And one expired at $2,200,000 after 184 days — the market's hard ceiling is clear. The data tells one story: price at $2.15M and the buyer pool is wide open; push to $2.25M only if 3-lot subdivision is confirmed — then the developer math changes the equation entirely.
| Property | Status | Lot Size | Living Area | Yr Built | Days on Mkt | Price | $ / sq ft (lot) |
|---|---|---|---|---|---|---|---|
| Subject 6801 SW 75th Terrace, South Miami 33143 | — | 29,563 sq ft | TBD | 1958 | — | — | — |
| ✅ Closed Sales | |||||||
| 8700 SW 64th Ave, Pinecrest 33156 | Sold | 21,344 sq ft | 2,326 sq ft | 1976 | 79 | $2,055,000 | $96.29 |
| 6910 SW 71st Ct, Miami 33143 | Sold | 20,000 sq ft | 3,629 sq ft | 1989 | 131 | $2,060,000 | $103.00 |
| 🟠 Pending (Active With Contract) | |||||||
| 7901 SW 72nd Ave, Miami 33143 | Pending | 44,879 sq ft | 1,516 sq ft | 1953 | 10 | $2,100,000 | $46.79 (list) |
| ❌ Expired (Cautionary) | |||||||
| 7260 SW 76th St, Miami 33143 | Expired | 33,541 sq ft | 1,108 sq ft | 1941 | 184 | $2,200,000 | $65.60 (exp.) |
Pool home with below-ground pool, 2-car garage, Florida room, fruit trees. Quiet one-block street near Gulliver HS. MLS noted "Priced at Land Value" — the developer pitch was explicit from day one. Closed all-cash at $2,055,000 in 79 days. At 21,344 sqft vs. the subject's 29,563, the subject carries 39% more land but is priced at a lower $/sqft — a compelling value for the right developer.
View Sale Record →Three structures: main house 3bd/2ba/den + guest cottage + office/gym/storage. South Miami schools. Septic tank, needs TLC. Listed at $2,200,000 and closed at $2,060,000 after 131 days — within 6.4% of ask. In the same South Miami corridor as the subject, this is the most directly relevant closed comp. At 20,000 sqft, the subject's 29,563 sqft gives meaningfully more land at a lower $/sqft entry.
View Sale Record →1-acre lot marketed explicitly as a developer opportunity — "steps to new luxury developments, shops, restaurants." Under contract in just 10 days at $2,100,000 — the fastest absorption in the comp set and the clearest signal of developer urgency. The subject's $2.15M–$2.25M range falls directly in line with this pending transaction, with a smaller (but still high-value) lot at a better per-sqft land price.
View Listing →Corner lot on dead end street. Originally listed at $2,500,000 — reduced to $2,200,000 and still failed to sell in 184 days. Limited service (flat-fee) listing. The market's verdict: $2,200,000+ does not clear for this asset class. This expired comp defines the ceiling. Strategy B ($2,150,000) sits just below this failure point; Strategy A ($2,250,000) pushes past it — justified only if 3-lot subdivision is confirmed, changing the buyer math entirely. A full-service listing with targeted developer outreach is a fundamentally different product than the flat-fee listing that expired here.
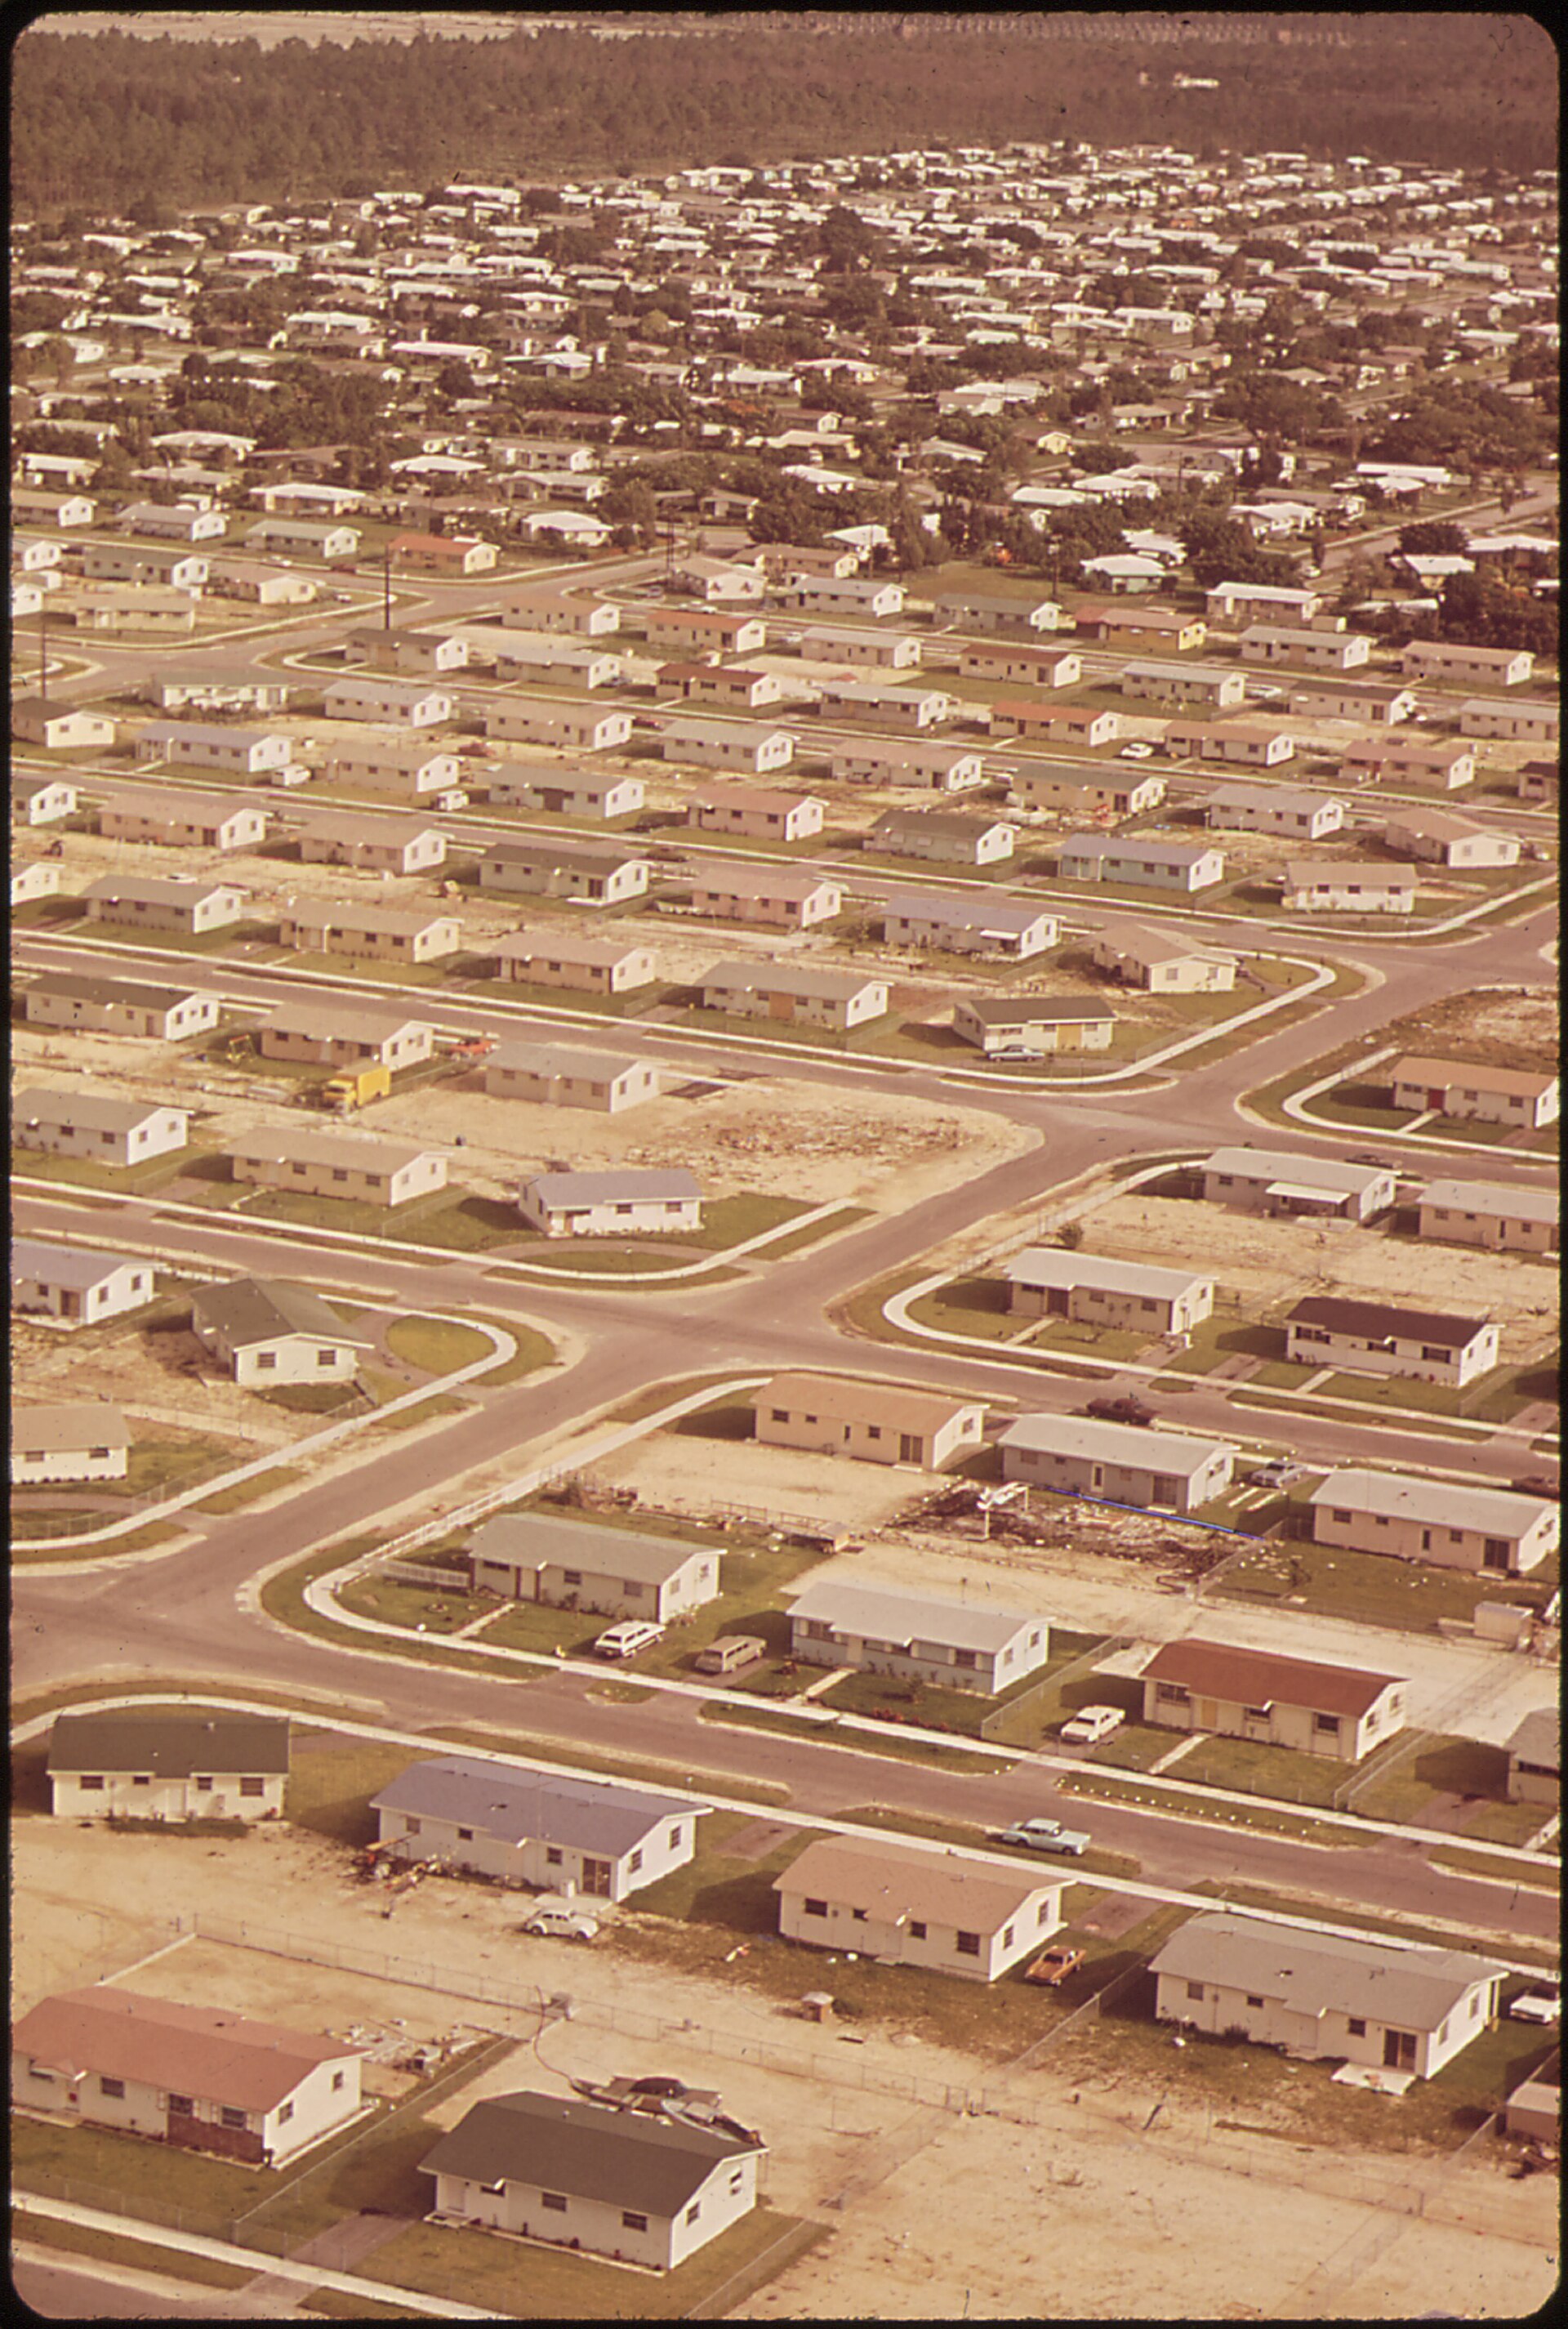
View Record →South Miami is one of Miami-Dade's most land-constrained municipalities. Lots exceeding 20,000 sq ft rarely appear on the open market — when they do, they attract developers, builders, and high-net-worth buyers simultaneously, compressing days-on-market to weeks. At 29,563 sq ft with subdivision potential, 6801 SW 75th Terrace is positioned at the intersection of scarcity and demand. The value here is 100% in the land — the buyer pool is developers, builders, and high-net-worth buyers wanting an estate lot. Comparable lot sales will be added once MLS data is confirmed, The $2.15M recommended price is anchored to closed comps; the $2.25M ceiling is supported if 3-lot subdivision is confirmed with the City of South Miami.
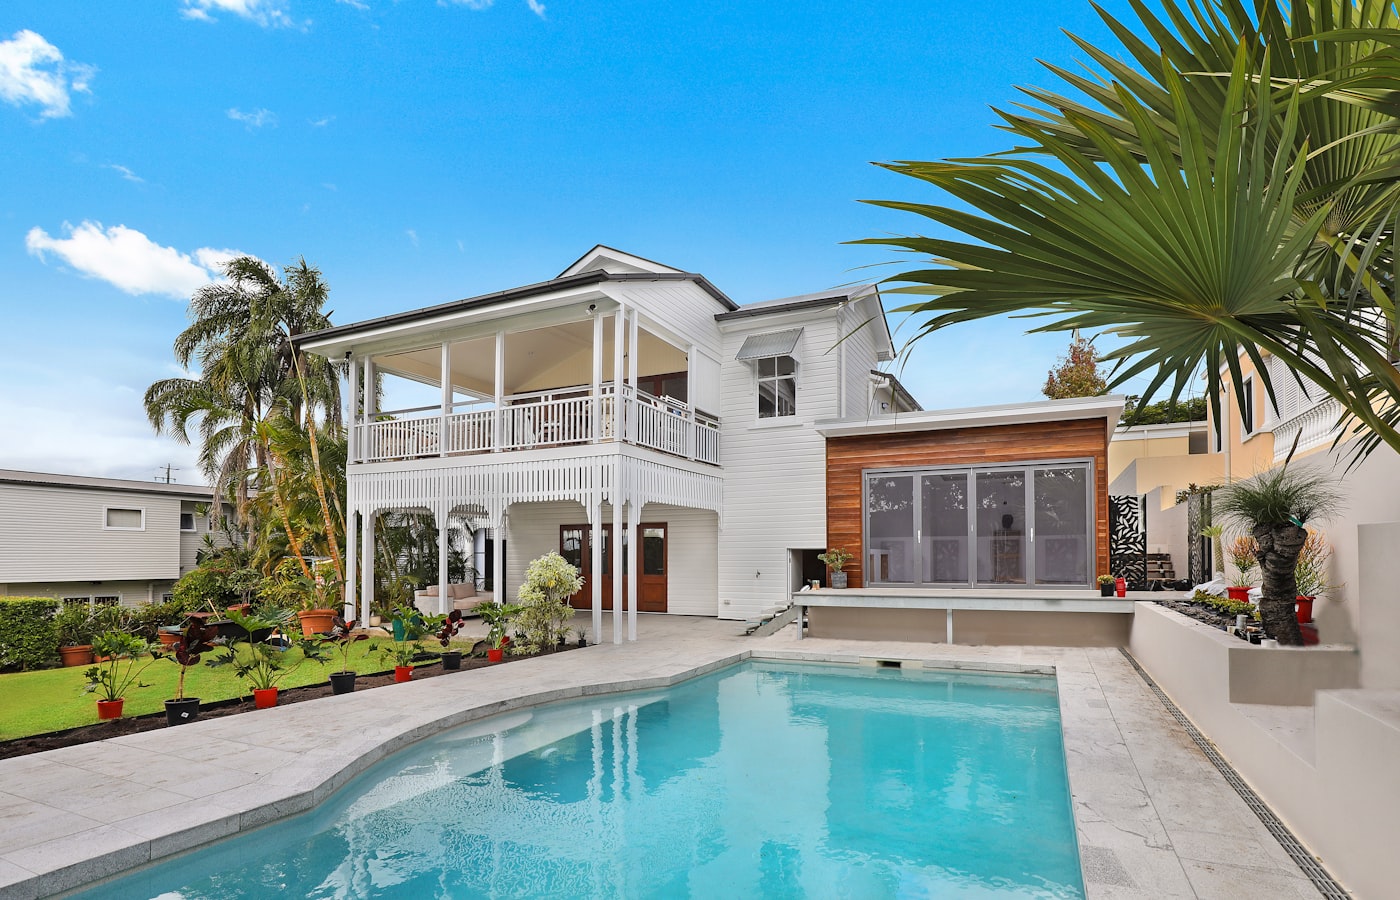
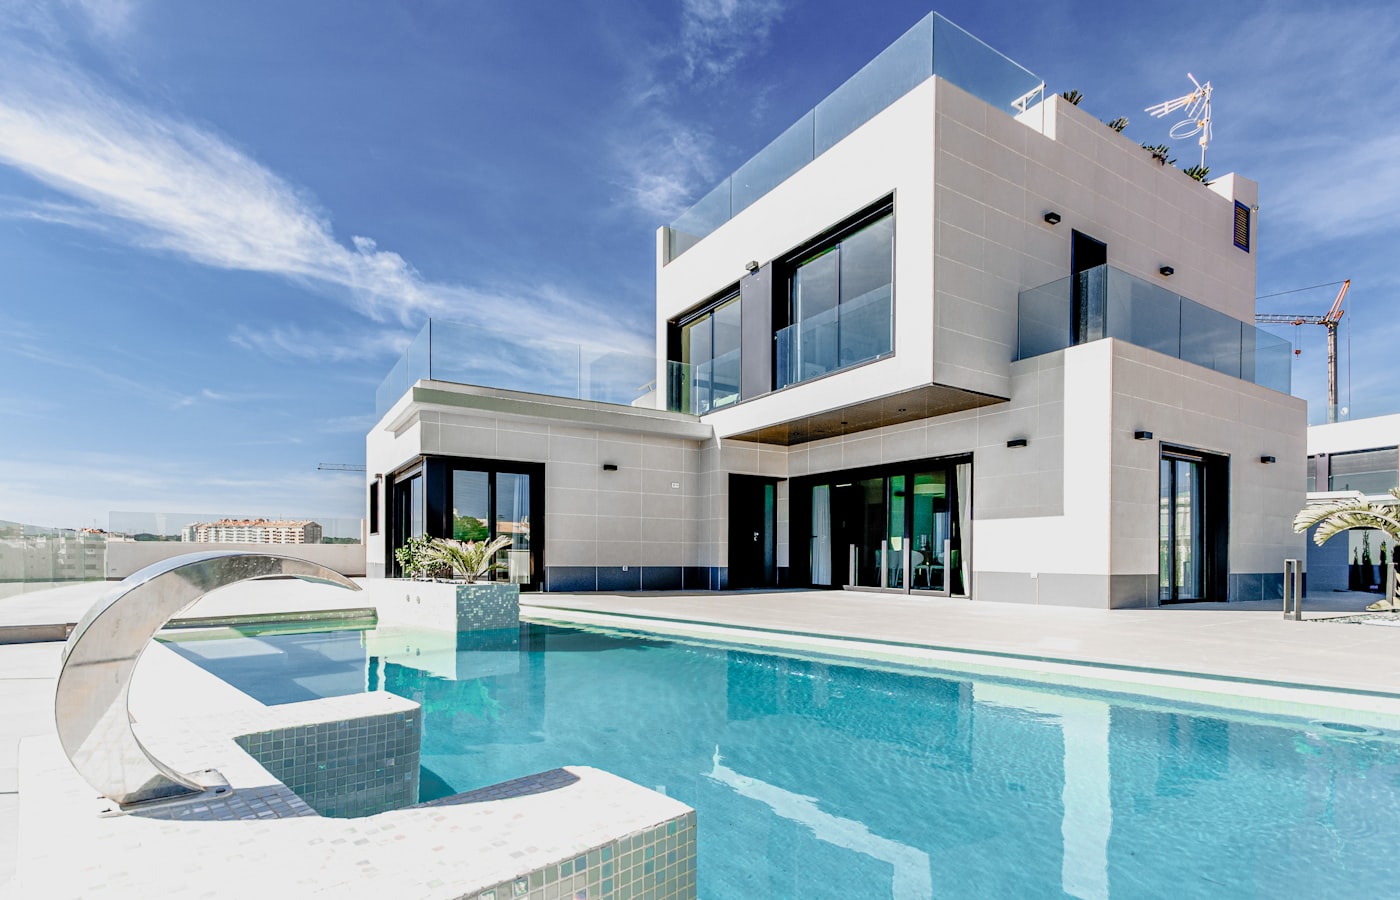
South Miami land is increasingly scarce. Large subdividable lots over 20,000 sq ft rarely come to market. The value here is 100% in the land — the buyer pool is developers, builders, and high-net-worth buyers wanting an estate lot. This environment supports confident positioning in the $2,150,000–$2,250,000 range.
This price is premised on the 3-lot subdivision scenario. If the City of South Miami confirms that three buildable parcels can be created from this lot — each capable of supporting a luxury new-construction home at $3M+ — the math justifies the $2.25M ask. The $2.25M anchor leaves room for a negotiated close above $2.15M and captures maximum upside for the right well-capitalized developer.
Recommended if subdivision yields two lots or if city confirmation is pending. This price is anchored directly to the two closed comp sales ($2,055,000 and $2,060,000) and the pending transaction at $2,100,000 — sitting right at the top of the confirmed comp range. It maximizes the buyer pool from day one and targets a negotiated close at or above $2,100,000.
The market is signaling we are overpriced relative to competing inventory. Time to reassess.
We are above active buyers' search thresholds. The listing needs a price or marketing adjustment immediately.
Regardless of activity, we conduct a full pricing review at 30 days — reassessing against any new comps, market shifts, and current competition.
This is a land play, not a comparables play. The buyer pool — developers, builders, and high-net-worth estate buyers — performs independent financial analysis before making an offer. Pricing at the right entry point draws multiple parties to the table simultaneously, which is where sellers win. Both strategies target a negotiated close that maximizes net proceeds while minimizing days on market.
Every home is different. Every seller has different priorities. I offer three compensation-based marketing plans so you can choose the level of exposure and service that aligns with your goals — and only pay for what you actually want.
These are actual reels and content produced for real listings — the same quality and strategy applied to your property.
Every home gets professional photography that showcases it at its best. Here are examples from recent sales and active listings.
Per the August 2024 NAR settlement, sellers are no longer required to offer buyer's agent compensation through the MLS. This gives you full flexibility in how you structure your agreement.
The majority of buyers — including developers and investors — are represented by their own agent. Offering compensation keeps all buyer pools fully open and removes friction at the offer stage — but the amount, if any, is entirely your decision.
For the purposes of this presentation, we're showing 3% buyer's agent compensation as a working number in the net proceeds calculator. The sale price dropdown lets you model all seven scenarios ($2,100,000–$2,250,000). We can revisit and adjust this at the time a specific offer is received.
| Listing Compensation (Momentum) | 3% |
| Buyer's Agent Compensation (working figure) | 3% |
| Total Compensation | 6% |
Buyer's agent compensation is a negotiating point at the time of contract. The 3% shown here is for illustration only — your actual exposure will be calculated against any offer received, giving you a real-time net sheet at every stage.
Use the selectors below to model different sale prices and compensation scenarios. Figures are estimates — your final net sheet with exact mortgage payoff will be prepared at the listing appointment.
| Sale Price (negotiated) | $2,150,000 (est.) |
| Less: Listing Agent Compensation — Momentum (3.0%) | –$61,500 |
| Less: Buyer's Agent Compensation (3.0%) | –$61,500 |
| Less: Miami-Dade Documentary Stamp Tax (0.60%) | –$14,350 |
| Less: Settlement / Closing Fee | –$1,800 (est.) |
| Less: Prorated Property Taxes (estimate) | –$12,000 (est.) |
| = Estimated Net BEFORE Mortgage | ~$1,887,062 (before mortgage payoff) |
| Less: Estimated Mortgage Payoff | –$0 |
| = Estimated Net At Closing (After Mortgage Payoff) | ~$1,887,062 |
Miami-Dade documentary stamp tax: $0.70 per $100 of sale price (0.60%). Title insurance is paid by the buyer in this transaction.
Florida has no state income tax. Federal capital gains rules apply — if this is your primary residence (lived in 2 of the last 5 years), you may exclude up to $250,000 ($500,000 married, filing jointly) in capital gains under IRS §121. Land sales may have different treatment — consult your CPA.
Per the August 2024 NAR settlement, buyer's agent compensation is no longer required to be offered via MLS. Compensation structure will be discussed at the listing appointment and is fully negotiable. Use the selector above to model different scenarios.
Here's what happens next. From signed agreement to sold — every step is handled with precision, transparency, and your goals at the center.
We formalize our partnership, confirm the list price based on the full land analysis, and set the official timeline for launch. We align on compensation plan, marketing approach, and any pre-listing tasks.
Aerial drone photography, land survey exhibit, property website, MLS entry, and full marketing campaign — activated within days of signing. Developer and builder networks get direct outreach at launch.
I handle every offer, every negotiation, every detail — from accepted offer to keys exchanged and funds wired. Land transactions move on their own timeline; I keep the deal on track from contract to closing.